About
. Research Engineer Intern at INRIA / IRISA Rennes. . Passionate about building and deploying scalable, secure systems. . Always exploring new ways to make systems smarter, more efficient, and resilient. . Currently seeking opportunities to Contribute, Learn, and Grow.
Work Experience
Education
Skills
Check out my latest work

DevSecOps & GitOps Pipeline for Microservices on Azure Infrastructure
A production-ready DevSecOps and GitOps ecosystem for EasyBus, a bus ticket management platform. The setup automates the secure delivery of Java Spring Boot microservices and a React frontend to a self-managed Kubernetes cluster deployed across Azure Virtual Machines. It features a robust Jenkins CI/CD pipeline integrated with deep security auditing, leveraging SonarQube for SAST and code quality alongside Trivy for container image scanning. Continuous delivery is managed declaratively via Argo CD and Argo CD Image Updater, ensuring immediate, automated synchronization between Git repositories and the infrastructure provisioned via Terraform.
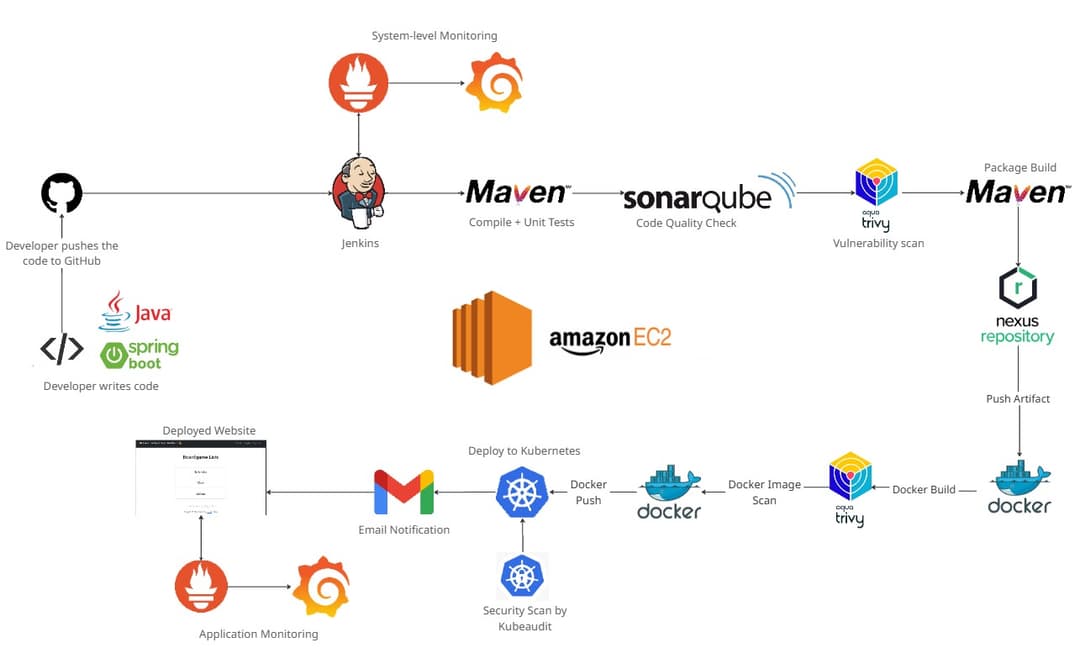
Automated CI/CD Pipeline for Spring Boot on AWS EC2
A CI/CD pipeline using Jenkins automates building, testing, and deploying a Spring Boot app on AWS EC2. It integrates with GitHub for continuous integration, uses Maven for packaging, Trivy and SonarQube for security and code quality, Nexus for artifact storage, Docker and Kubernetes for deployment, and Prometheus–Grafana for monitoring with email alerts for updates.
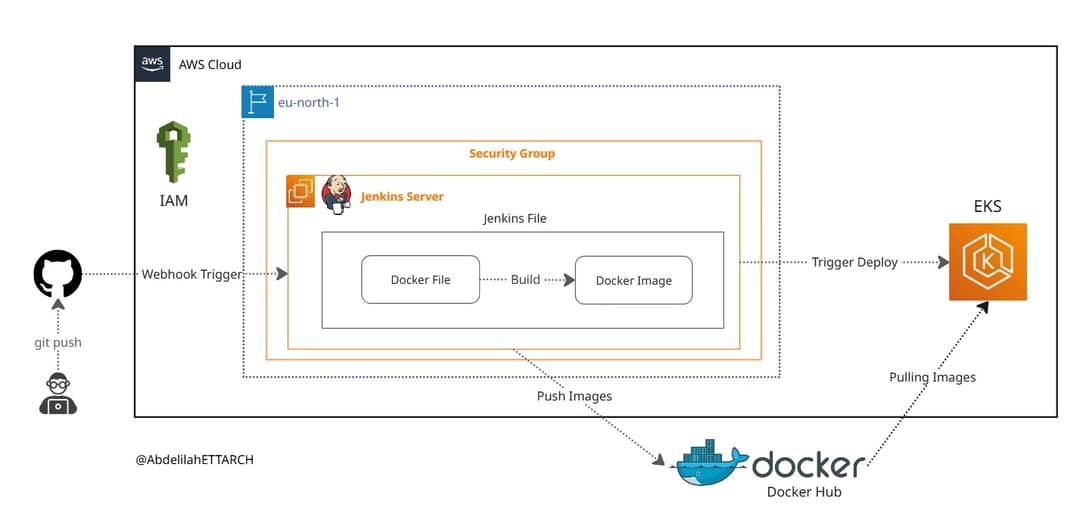
Deploy 11 E-Commerce Microservices on AWS EKS with Automated CI/CD
A production-grade CI/CD pipeline using Jenkins automates the entire deployment of 11 independent microservices onto AWS EKS. It integrates with GitHub Webhooks for continuous integration, uses Docker for containerization, and leverages Kubernetes for orchestration and service discovery. AWS ELB provides load balancing, and the entire setup utilizes AWS IAM for secure access, resulting in a fully automated, scalable e-commerce platform.
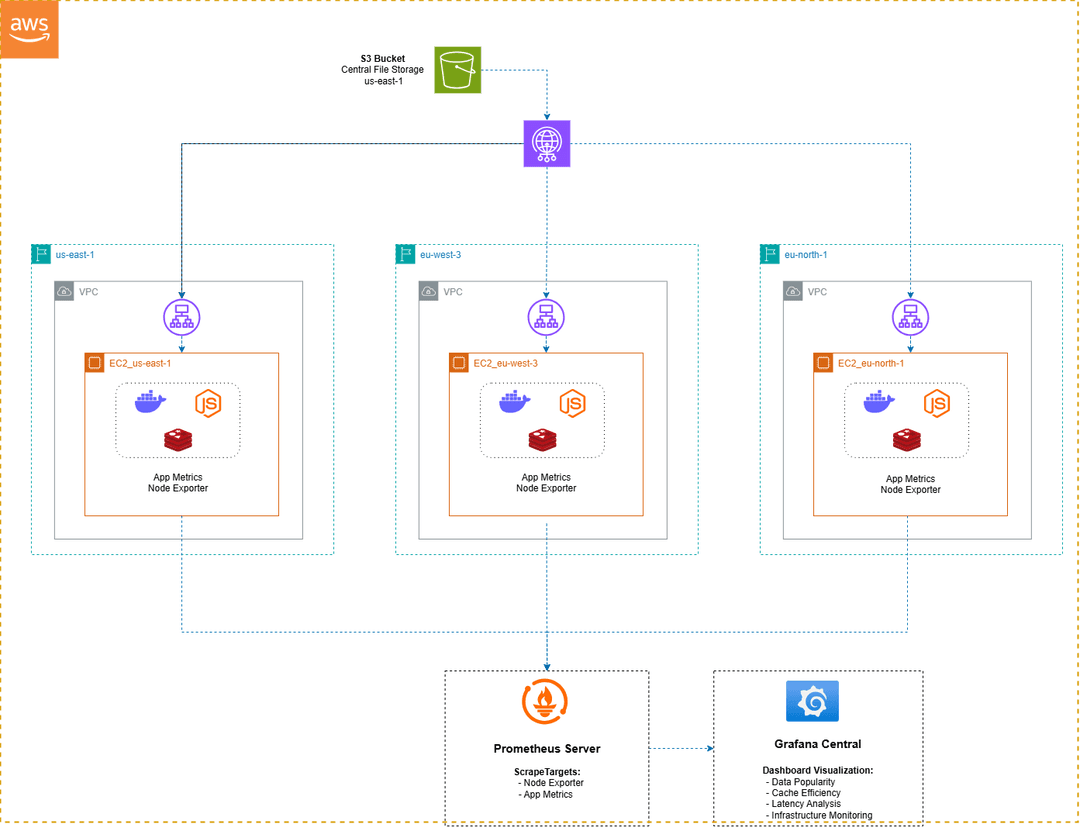
Geo Distributed System Monitoring
An observability and monitoring setup was designed and deployed to track file data popularity, cache efficiency, request latency, and infrastructure resource usage across Geo-distributed regions. It uses AWS S3 for global data storage and Redis for regional caching to optimize performance. Prometheus collects metrics such as file access frequency, cache hits and misses, and server utilization, while Grafana dashboards provide clear insights into system behavior and performance trends. Tracked files are displayed through a simple Public Health & Wellness Resources web interface, combining backend monitoring with user-friendly data visualization.
Things I write about
I share insights on DevOps, CI/CD security, and cloud computing. Writing helps me reflect on real projects and share practical knowledge with others in the tech community.
- S
Stop the Breach: How to Bulletproof Your CI/CD Pipeline and Sleep Better at Night
Learn how to secure your CI/CD pipeline from source code to deployment, protect secrets, and automate vulnerability scans…